How to Read JCapper Reports after running a Calc Races
In this document, I'll present some screenshots of
the Text Report and HTML Report and follow that up with some hints on what to
look for and why. I'll then follow that up with some very blatant examples of
what to look for.
Note: Most of
the screenshots used in this document are based on the original JRating enabled
version of JCapper first made available in the fall of 2004. Later versions
have screens that differ slightly in appearance. No matter what version of
JCapper you have, the same principles about what to look for still apply.
Horses that fit the UDM Definitions of active UDMs will be marked on the HTML
Report. When the Morning Line Odds divided by Probability Odds Line is greater
than defined Odds Ratio Cutoffs Overlay Highlighting will kick in. Each and
every race day there will be overlays just waiting to be found.
The Text
Report
Each time it is run, one of the things the Profile
Marker does is create a text file named AtAPrice.txt in the default data folder.
This file contains all of the UDM plays identified for the day. It is sorted by
track and then by race.
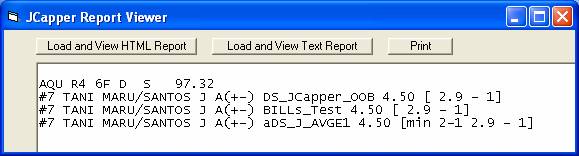
The above screenshot shows a portion of the text
report for
Here's how to read it:
Reading across the top line we have:
1. The three character Track Code for the track of the current race. Also the first three characters of the data file loaded into the program for the current Calc Races. In this case:
AQU
2. The race number. In this case: Race 4.
3. The distance in furlongs. In this case: 6F.
4. Class Descriptor. In this case: S to
indicate a Maiden Special Weight race.
5. The Race Volatility score. In this case 97.32
Then, reading across the bottom line we have:
1. The post position. In this
case horse #7.
2. The horse's name. In this
case TANI MARU.
3. The rider's name as listed
in the Past Performance Data File (HDW or Brisent) used for the current Calc Races. In this case SANTOS J A or Jose Santos.
4. The rider rating in
parenthesis. This part is subjective and has been placed there by the program's
author. A detailed explanation of this rating appears in the notes below.
5. The name of the UDM taken
from the PROFILE field in the profile Table - in this case: DS_JCapper_OOB.
6. The morning line odds - In
this case 9-2.
7. The betting instructions
in brackets. This can be: 1.The default is the odds line generated by the
program. This can be activated or de-activated by checking or un-checking the
OL Test checkbox with the UDM Wizard when creating or modifying the UDM
Definition itself. B. Any text placed in the BETTINGINSTRUCTIONS field of the
profile table will also appear to the left of the fair odds line. This is a
perfect place to place a reminder as to how to bet this particular type of
play. Examples of this might be "WP" for win and place or
"W" for win only, etc.
8. A separate line is shown
for each UDM that each horse qualifies for. If multiple horses qualify as UDM
plays, they will be listed separately.
Important Note
about Odds Line display on the Reports and in the Data Window
Odds Line Type
Displayed on the Reports - In the original JCapper there was only one odds line: AProbOL. In
the summer of 2005 I added the PScoreOL and gave users a choice of which Odds
Line to display on the reports. In JCapper2007 users have two additional
choices: JPRMLOL and UPRMLOL (or User Defined Odds Line.) There is only so much
room on the HTML Report. The program has hundreds of factors and I can’t
possibly fit all of them on the HTML Report. For that reason, you the user,
have a responsibility. You have to go into the System Settings/System
Definitions Screen and choose the single odds line type that best fits your own
UDMs. The Odds Line that you select and save on the System Definitions Screen
is the odds line that you’ll see displayed on your reports.
Default Odds
Line Type for UDMs in the Data Window –When you check the OL Test checkbox for a UDM in
the UDM Wizard you are adding a requirement to the UDM Definition that the UDM
only select horses that go off at odds greater than or equal to the odds
expressed by the odds line. Sounds easy
so far, right? But hold on a second. Which odds line? You have several choices,
remember? There is a rule covering this and here it is: The same Odds Line that
you select and save on the System Definitions Screen that drives the odds line
you see displayed on your reports is the same odds line used as a default by
the Data Window when you run your UDMs through the Data Window.
So if you have JPRMLOL saved in System Definitions
you will see the JPRMLOL (also called JPRMLProbOL) on your reports. If you have
a UDM where you have checked the OL Test box and you run that UDM through the
Data Window using the UDM button – the Data Window will evaluate each horse in
the database and make a comparison between post time odds and the odds
expressed by the JPRMLOL when it determines whether or not that horse should be
returned as part of your query results.
Use the System Definitions Screen to change to a
different Odds Line type and your new Odds Line type will drive what you see on
the reports and in the Data Window.
The HTML
Report (JCapper 2005)
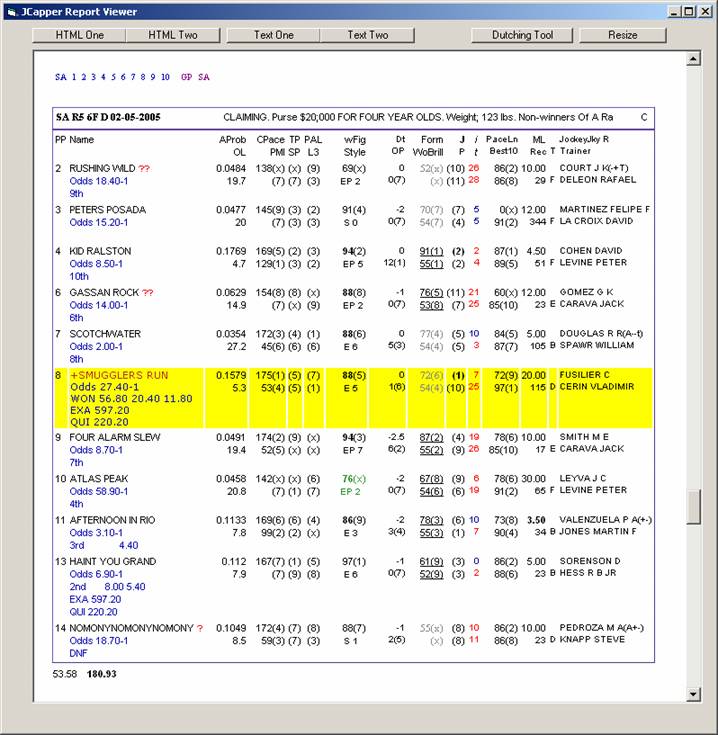
In this section we’ll examine an HTML Report run for
SA R5 2-05-2005 using JCapper 2005.
Figure
01 SAX R5
Each time it is run, the HTML Report generator
creates an HTML file named Report_1.html in the default data folder. This file
can be viewed in your web browser or the JCapper Report Viewer. The file
contains a table for each race found in the Past Performance Data Files (HDW or Brisnet) for all race
cards loaded into the program via the DFM Card Loader. The report is sorted by track (in the order they were loaded on each folder) and then
by race number.
The above screenshot shows the HTML Report for race
5 at Santa Anita on
1. Links to Loaded Race Cards. Clickable. Clicking
on GP will cause navigation to race 1 for
.
2. Race Header - Shown is Santa Anita, Race 5, at 6
furlongs, on the dirt, on
Then we have a row for each horse. Going across the
top from left to right we have:
PP - Post Position.
Name- Name of the horse. If the
horse fits a UDM Definition, the horse name is highlighted in red. The “+”
character just to the left of horses marked as UDM plays is clickable. Clicking
the “+” character will call a JavaScript function that expands and displays a
hidden node containing all of the separate UDM names that are pointing to this
horse.
Note: Some of the horses have red question marks
after their names. A single red question mark indicates an XFORM horse. Double
red question marks indicate a CANTRUN horse.
XFORM has to do with trainer intent. Things like no
lasix, adding blinkers to correct a problem, and a lack of a workout base –
when present these subtle signals often point out that the trainer is not
gunning for a win today. In JCapper, horses are considered to be either XFORM
or YFORM. A horse can never be both. A horse is considered to be YFORM whenever
the past performance record has a complete absence of XFORM traits. It isn’t a
perfect scoring system. XFORM horses do win races. But taken as a group, XFORM
horses win statistically fewer races than YFORM horses. More importantly,
historical win ROI for XFORM horses is lower than the historical win ROI of
YFORM horses.
CANTRUN has to do with a horse being in over its
head today. In JCapper, horses are considered to be either CANTRUN or CANRUN. A
horse can never be both. A horse is considered to be CANRUN whenever the past
performance record has a complete absence of CANTRUN traits. Again, it isn’t a
perfect scoring system. CANTRUN horses do occasionally win races. But taken as
a group, CANTRUN horses win statistically far fewer races than CANRUN horses.
More importantly, historical win ROI for CANTRUN horses is far lower than the
historical win ROI of CANRUN horses.
The absence of question marks indicates a CLEAN
horse. Horses with question marks are considered to be DIRTY horses. Again, in
JCapper, this simple concept means that horses are considered to be either
CLEAN or DIRTY. A horse can never be both. A horse is considered to be CLEAN
whenever the past performance record has a complete absence of DIRTY traits.
Again, this isn’t a perfect scoring system. DIRTY horses do win races. But taken
as a group, CLEAN horses win statistically more races than DIRTY horses. More
importantly, historical win ROI for CLEAN horses higher than the historical win
ROI of DIRTY horses.
AProb- Assigned Probability
OL- Assigned Probability Odds
Line (shown.) or PScore Odds Line (not shown.) User may select display of odds
line type in System Settings/System Definitions screen.
Note: When Assigned Probability Odds Line is shown,
a mouse click on it will reveal the PScore Odds Line and vice versa.
CPace- Comprehensive Pace Rating
(click to view PScore) followed by CPace rank in parenthesis.
PMI- Pace Model Index (click to
view PScore) followed by PMI rank in parenthesis.
TP- Rank for TPace (click to
view numeric value)
SP -Rank for Sustained Pace
(located just beneath TPace rank/click to view numeric value)
PAL- Rank for Pace Adjusted
Late (click to view numeric value)
L3- Rank for Late Pace Best of
Last 3 (located just beneath PAL
rank/click to view numeric value)
WFig- Weighted Figure followed
by rank in parenthesis. Weighted Speed Figures shown in green whenever a horse
ran on the turf in its most recent start. Weighted Speed Figures shown in black
indicate horses that ran on the dirt in their most recent start.
Running Style
and Q Speed Points - as read directly from the Past Performance Data File (HDW or Brisnet.)
Dt- Distance Shift – the
number of furlongs plus or minus that today’s race is shorter or longer than
the horse’s previous race. Negative numbers indicate that a horse is shortening
up in distance. Positive numbers indicate that a horse is stretching out. A Dt
of zero indicates that today’s race is at the same distance as the horse’s
previous race.
OP- Optimization Points
followed by rank in parenthesis.
Form- Form Rating followed by
rank in parenthesis.
WoBrill- Workout Brilliance
followed by rank in parenthesis.
J- Rank for
JRating.
Click to view number for rating.
P- Rank for Prime Power
Rating. Click to view number for rating with PF1 and PF2.
i- Improvement or decline in HDW or Brisnet Final Time Speed Figure
from second start back to most recent start. Positive numbers are shown in
black. Negative numbers are shown in red.
t- Difference in HDW or Brisnet Final Time Speed Figure from the
horse’s previous top. Speed figure of the horse’s most recent race is compared
to the speed figure from the previous top. Positive numbers are shown in black.
Negative numbers are shown in red.
PaceLn- PaceLine – the best HDW or Brisnet Final Time Speed Figure
as selected by the user defined PaceLine selection rules
found on the User System Definitions Screen. My own preferences are
to select the best speed figure from the 5 most recent starts and from the most
recent 120 days while requiring that the race be at a similar distance and have
been run on the same surface as today’s race. I do it this way for a reason.
Whenever I see a horse with a zero for PaceLine I know at a glance that the
horse hasn’t had a race at a similar distance as today’s race on the same
surface (dirt or turf) as today’s race within its last five starts or within
the last four months. I know at a glance that the horse is trying something new
today.
Note: PaceLine settings on the User System
Definitions Screen affect the PaceLine number only. The premier
ratings in the original JCapper program such as JRating, CPace, PMI, OP, Form, and WoBrill, etc.
are all hard coded into the program and are not affected by user PaceLine selection
rules. This is by design.
Note that the current version of JCapper Platinum has a feature called UPR Tools.
This feature gives players the ability to create their own factors and probability estimates using other factors as inputs.
If you are using the factor called PaceLine as an input (along with other factors as inputs) in UPR Tools, that means your resulting
output factor would be affected by the usr defined PaceLine settings on your User System Definitions Screen.
Best10- HDW or Brisnet Final Time Speed Figure (Best
of Last 10) followed by rank in parenthesis.
ML- Morning Line Odds
Rec- Recent Activity (Days Last
Start)
T- Grade for trainer based on
win percent. These are letter grades that correspond to trainer win percent.
The # character indicates a 25 pct or better win percent at the current meet.
The A character indicates a 20 pct or better win percent at the current meet.
The B character indicates a 15 pct or better win percent at the current meet.
The C character indicates a 10 pct or better win percent at the current meet.
The D character indicates a 5 pct or better win percent at the current meet.
The E character indicates less than a 5 pct win percent at the current meet.
The F character indicates no starts at the current meet.
Trainer Name – This is an optional
setting. To display the trainer name on the HTML Report, check the Display
Trainer Name check box found in the System Settings/System Definitions Screen.
Jockey- Name of Rider
JkyR- Rider Rating in
parenthesis when present.
Rider Rating
Explanation
I must admit that this part is something I
added to the original JCapper program for my own personal use. It was based on my own Data Window research into the
tendencies of individual riders.
During 2004-2006 I made periodic edits to the rider rating as free time allowed.
Rating: (A++T)
Trainer character: Possible values are "A"
or simply left blank. The presence of an A indicates that one or more trainers
with a win percent greater than 20 percent have used this rider as a "go
to" rider in the recent past. If no trainer character is present, this
means that I haven't noticed this rider being used as a go to rider by a 20
percent trainer,
Sprint Dirt Rating. This is the first + or -
character. A plus indicates that this rider has historically outperformed a
normal expectation in sprint races in terms of both win rate and roi. A minus
indicates that the rider has historically underperformed.
Route Dirt Rating. This is the second + or -
character. A plus indicates that this rider has historically outperformed a
normal expectation in route races in terms of both win rate and roi. A minus
indicates that the rider has historically underperformed.
Turf Rating: This is the letter appearing to the
right of the dirt route rating. An upper case "T" indicates that this
rider has historically outperfornmed a normal expectaion both in terms of win
rate and roi in
A little history about the rider rating symbols:
The Rider Rating Symbols shown in the above screenshots were hard coded into the original JCapper program and were based on research I did into the abilities of the men and women who were riding at that time (1998-2004.)
I first started using them in a very early version of JCapper around 1998. I discovered that certain riders excelled at gunning horses from the gate, getting them to relax while racing on or near the lead, getting enough separation on the turn, and (finally) getting enough out of them in the stretch to get to the wire first. Other riders (most actually) come up short in this area. Knowing which riders possess this skillset can make for some very nice UDMs.
Many of my early UDMs were based on just three factors:
1. A speed favoring surface.
2. An advantage in early speed.
3. A rider who knows what to do.
It was (and still can be) a very potent combination. In 1999 Victor Espinoza was a rider on my "list" and he rode Spain (who was top 3 in CPace) to victory in the Breeder's Cup Distaff on a speed favoring surface that day at odds of more than 50-1.
These symbols are a leftover from the way I used to do things. Up until late 2003 I used to manually recompile the rider rating symbols every 90 days or so - and then hard code them into the program.
Over the years the abilities of the riders these symbols are based on have changed - significantly. Also, most if not all of the riders from my original "list" (Pat Day, Laffit Pincay, Rafael Meza, Robbie Davis, etc.) are no longer even riding.
I originally wanted to remove the symbols from JCapper when I started selling copies of it. A handful of my first customers asked me to leave the symbols intact on the HTML Report. So I did. But keep in mind I haven't updated the symbols in years and have no plans whatsoever of doing so.
However, as the home grown program that would eventually become JCapper evolved, I gave the user the ability to create UDMs, and shortly after that, the ability to create UDMs with the ability to flag riders and trainers by name. (It was at that point in the evolution of the program that the symbols became obsolete.)
In my opinion, UDMs with the ability to flag riders and trainers by name (based on your own research) is a much better way of doing things than a static set of symbols ever could be.
Hint: If you are interested in doing your own R&D into the abilities of riders and trainers I suggest you check out the BY RIDER and BY TRAINER options in the Data Window Factors Drop Down. From there, if you are interested in an easy way to compile name lists involving hundreds of riders and/or trainers so that you can get them into a UDM Definition - you should probably log into the JCapper Message Board and do a search for the Name Selection Tool (especially if you are operating JCapper in SQL Mode.)
Hint: If you are interested in robotically scoring riders and trainers from historical data I suggest you check out Prob Expressions (especially if you are operating JCapper in SQL Mode and/or are interested in using rider and trainer scores as inputs in a model.)
The symbols were nice to have back in the day. But they have since been eclipsed by some extremely powerful tools.
-jp
.
Owner Name – This is an optional
setting. To display the owner name on the HTML Report, check the Display Owner
Name check box found in the System Settings/System Definitions Screen. Note:
the owner name is not shown on the screenshot above.
Below the frame displaying the data for the race are
two more numbers. From left to right, they are:
1. PaceIndex
2. Race Volatility (shown in bold)
Glossary of
Supported Factors
A complete glossary of all factors supported in
JCapper can be found on the JCapper website on the Supported Factors page.
Overlay
Highlighting
Another feature of the program is MLine Odds Ratio
II (MLOR2) highlighting on the HTML Report. This feature can be turned on or
turned off in the System Settings Interface/System Definitions Screen according
to individual user preferences. When turned on, if MLine Odds Ratio II is 1.30
or higher, the horse is highlighted in light yellow. When MLine Odds Ratio II
is 2.0 or higher, the horse is highlighted in very bright yellow. Only horses
that are program contenders are highlighted. The following horses in JCapper
are considered program contenders:
1. UDM Selections
2. JRating rank=1
3. JRating rank=2
4. CPace rank=1
No other horses will be highlighted.
Note: In newer non-JRating versions of JCapper the
following horses are subject to overlay highlighting:
1. UDM Selections
2. JPR rank=1
3. JPR rank=2
4. CPace rank=1
No other horses will be highlighted.
Note about
Printing the HTML Report and Overlay Highlighting using Internet Explorer
On most machines the Internet Explorer default
settings for printing of background colors are disabled. In JCapper Overlay
Highlighting on the HTML Report is achieved using a programming convention
called CSS (a Cascading Style Sheet.) JCapper uses CSS to set the
background-color attribute of the row to be highlighted. The browser then
interprets the background-color attribute and renders the row accordingly so
that you see the individual horse highlighted on your screen.
To enable Overlay Highlighting for HTML Reports
printed out on paper using Internet Explorer, the following setting(s) (as shown click here) must be enabled
in Internet Explorer:
Internet options, advanced tab.......check the box labeled
"print background
text and images"
Results
Display
JCapper*.DAT files are created by the Results File
Importer during a Database Build. This is a special file format containing both
past performance and results data. JCapper*.DAT files can be loaded into the
program just like HDW or Brisnet data files. After loading a JCapper*.DAT file,
after Calculating Races, odds, placings, and payoffs are displayed on the HTML
Report in blue font.
Factor
Rankings
The ranking of each horse relative to the field is
displayed for all numeric factors. A rank of (1) indicates the horse was the
ranked highest for that factor. A rank of (x) indicates the horse ranked 10th
or worse for that factor.
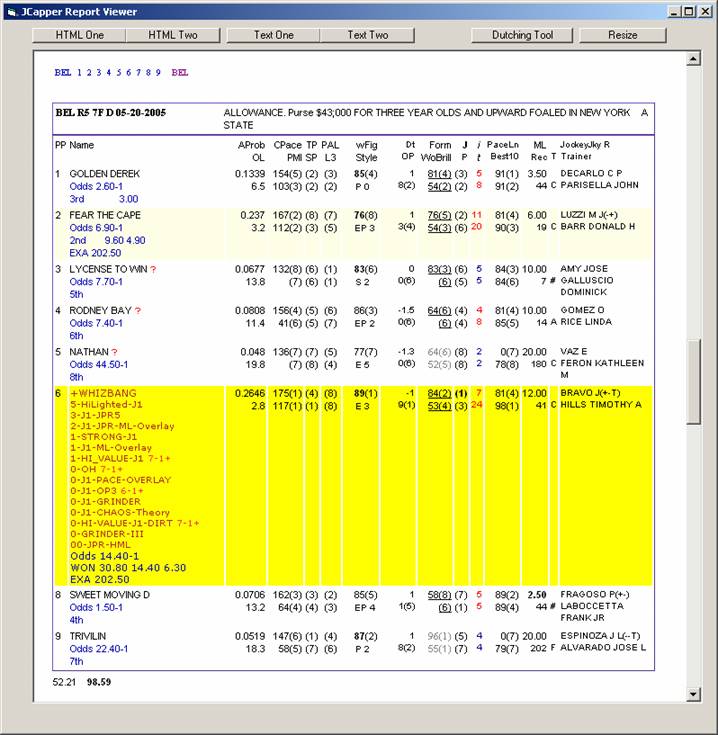
Figure 02 BEL R5
The HTML
Report (JCapper 2008)
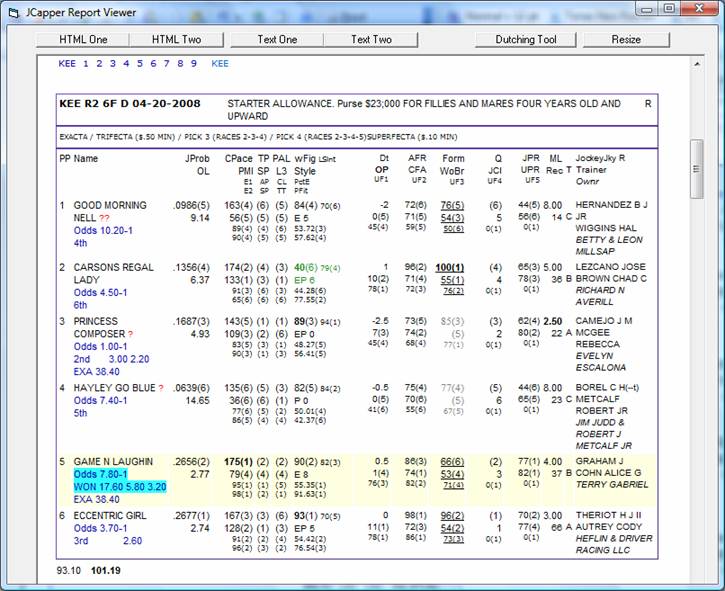
In this section we’ll examine an HTML Report run for
KEE R2 4-20-2008 using JCapper 2008.
Figure
01a KEE R2 04-20-2008
Each time it is run, the HTML Report generator
creates an HTML file named Report_1.html in the default data folder. This file
can be viewed in your web browser or the JCapper Report Viewer. The file
contains a table for each race found in the HDW or Brisnet Past Performance Data File for all loaded race
cards. The report is sorted by track (in the order they were loaded) and then
by race number.
The above screenshot shows the HTML Report for race
2 at Keeneland on 04-20-2008. The race was won by #5 horse, Game N Laughin, who was
ranked 1st in JPR, UPR, CPace, CompoundE1, CompoundE2, and CompoundPaceFit. My point for
choosing this race is to emphasize the importance the Compound Pace Array factors
can play in pointing out horses with pace advantages over their fields. One of my favorite
play types is the horse that can get the lead right from the gate, face very little pace
pressure from other horses during the running of the race, and have enough left in
the tank to get to the wire first at good odds. This horse is a perfect example of that.
In this case the top CPace and CompoundPaceFit numbers are indicative of a pace advantage.
Combine that with strong JPR and UPR numbers and you have a horse with plenty of hidden positives.
This horse won easily and paid $17.60.
Starting with the top line, here's how to read the report:
1. Links to Loaded Race Cards. Clickable. Clicking
on KEE will cause navigation to race 1 for KEE. Clicking on another track will
cause navigation to race 1 for that track. Clicking on any of the individual
race numbers will cause navigation to that race for the current track.
.
2. Race Header - Shown is KEE, Race 2, at 6
furlongs, on the dirt, on 04-20-2008. The abbreviated race conditions are shown
if they are available in the HDW or Brisnet Past Performance Data File.
Then we have 4 rows for each horse. Going across the
top from left to right we have:
PP - Post Position.
Name- Name of the horse. If the
horse fits a UDM Definition, the horse name is highlighted in red. The “+”
character just to the left of horses marked as UDM plays is clickable. Clicking
the “+” character will call a JavaScript function that expands and displays a
hidden node containing all of the separate UDM names that are pointing to this
horse.
Note: Some of the horses have red question marks
after their names. A single red question mark indicates an XFORM horse. Double
red question marks indicate a CANTRUN horse.
XFORM has to do with trainer intent. Things like no
lasix, adding blinkers to correct a problem, and a lack of a workout base –
when present these subtle signals often point out that the trainer is not
gunning for a win today. In JCapper, horses are considered to be either XFORM
or YFORM. A horse can never be both. A horse is considered to be YFORM whenever
the past performance record has a complete absence of XFORM traits. It isn’t a
perfect scoring system. XFORM horses do win races. But taken as a group, XFORM
horses win statistically fewer races than YFORM horses. More importantly,
historical win ROI for XFORM horses is lower than the historical win ROI of
YFORM horses.
CANTRUN has to do with a horse being in over its
head today. In JCapper, horses are considered to be either CANTRUN or CANRUN. A
horse can never be both. A horse is considered to be CANRUN whenever the past
performance record has a complete absence of CANTRUN traits. Again, it isn’t a
perfect scoring system. CANTRUN horses do occasionally win races. But taken as
a group, CANTRUN horses win statistically far fewer races than CANRUN horses.
More importantly, historical win ROI for CANTRUN horses is far lower than the
historical win ROI of CANRUN horses.
The absence of question marks indicates a CLEAN
horse. Horses with question marks are considered to be DIRTY horses. Again, in
JCapper, this simple concept means that horses are considered to be either
CLEAN or DIRTY. A horse can never be both. A horse is considered to be CLEAN
whenever the past performance record has a complete absence of DIRTY traits.
Again, this isn’t a perfect scoring system. DIRTY horses do win races. But
taken as a group, CLEAN horses win statistically more races than DIRTY horses.
More importantly, historical win ROI for CLEAN horses higher than the
historical win ROI of DIRTY horses.
JProb- JPRML Probability
OL- Probability Odds Line…
JPRMLProb OL shown. Other options include UPRMLProbOL, AProb (for JRating
enabled users only) and PScoreOL (again
for JRating enabled users only.) User may select display of odds line type on
System Settings/System Definitions screen.
Pace Synopsis
CPace- Comprehensive Pace Rating
(click to view PScore) followed by CPace rank in parenthesis.
PMI- Pace Model Index (click to
view PScore) followed by PMI rank in parenthesis.
E1- CompoundE1 followed by rank
in parenthesis.
E2- CompoundE2 followed by rank
in parenthesis.
TP- Rank for TPace (click to
view numeric value)
SP -Rank for Sustained Pace
(located just beneath TPace rank/click to view numeric value)
AP- Rank for CompoundAP (click
to view numeric value)
SP- Rank for CompoundSP (click
to view numeric value)
PAL- Rank for Pace Adjusted
Late (click to view numeric value)
L3- Rank for Late Pace Best of
Last 3 (located just beneath PAL
rank/click to view numeric value)
CL- Rank for CompoundLate (click
to view numeric value)
TT- Rank for CompoundTurnTime
(click to view numeric value)
WFig- Weighted Figure followed
by rank in parenthesis. Weighted Speed Figures shown in green whenever a horse
ran on the turf in its most recent start. Weighted Speed Figures shown in black
indicate horses that ran on the dirt in their most recent start.
LateSlant – Late Slant Weighted Speed
Figure followed by rank in parenthesis. Appears just to the right of Weighted
Speed Figure.
Running Style
and Q Speed Points - as read directly from the HDW or Brisnet Past Performance Data File.
PctE- CompoundPctE followed by
rank in parenthesis.
PFit- CompoundPaceFit followed by
rank in parenthesis.
Dt- Distance Shift – the
number of furlongs plus or minus that today’s race is shorter or longer than
the horse’s previous race. Negative numbers indicate that a horse is shortening
up in distance. Positive numbers indicate that a horse is stretching out. A Dt
of zero indicates that today’s race is at the same distance as the horse’s
previous race.
OP- Optimization Points
followed by rank in parenthesis.
UF1- UserFactor1 followed by
rank in parenthesis.
AFR- Advanced Form Rating
followed by rank in parenthesis.
CFA- Competitive Figure
Analysis followed by rank in parenthesis.
UF2- UserFactor2 followed by
rank in parenthesis.
Form- Form Rating followed by
rank in parenthesis.
WoBrill- Workout Brilliance
followed by rank in parenthesis.
UF3- UserFactor3 followed by rank
in parenthesis.
Q- Rank for QRating. Click to
view number for rating.
JCl- Rank for JPRClass. Click
to view number for rating.
UF4- UserFactor4 followed by rank
in parenthesis.
Note: JRating enabled users will see Rank for
JRating instead of Rank for QRating in the above report section.
JPR- JPR followed by rank in
parenthesis.
UPR- UPR followed by rank in
parenthesis.
UF5- UserFactor5 followed by rank
in parenthesis.
Note: Users will see identical numbers for JPR and
UPR in the above report section until they have taken the time to use the
Impact Values Table Wizard to build their own UPR.
Note: Users will see zero for UserFactors until they
have taken the time to use the Impact Values Table Wizard to create their own
UserFactors.
Displaying UserFactors on the HTML Report
Note: There is a checkbox on the System
Settings/System Definitions Screen that enables display of UserFactors 1-5 on
the HTML Report. When this box is checked UserFactors 1-5 will appear on the
HTML Report. When not checked, UserFactors 1-5 will not appear on the report.
Displaying the
Compound Pace Array on the HTML Report
Note: There is a checkbox on the System
Settings/System Definitions Screen that enables display of The Compound Pace
Array on the HTML Report. When this box is checked The Compound Pace Array will
appear on the HTML Report. When not checked, The Compound Pace Array will not
appear on the report. The following factors are part of the JCapper Compound
Pace Array: CompoundE1, CompoundE2, CompoundTT, CompoundAP, CompoundSP,
CompoundPctE, CompoundPaceFit, and LateSlant.
ML- Morning Line Odds
Rec- Recent Activity (Days Last
Start)
T- Grade for trainer based on
win percent. These are letter grades that correspond to trainer win percent.
The # character indicates a 25 pct or better win percent at the current meet.
The A character indicates a 20 pct or better win percent at the current meet.
The B character indicates a 15 pct or better win percent at the current meet.
The C character indicates a 10 pct or better win percent at the current meet.
The D character indicates a 5 pct or better win percent at the current meet.
The E character indicates less than a 5 pct win percent at the current meet.
The F character indicates no starts at the current meet.
Trainer Name – This is an optional
setting. To display the trainer name on the HTML Report, check the Display
Trainer Name check box found in the System Settings/System Definitions Screen.
Jockey- Name of Rider
JkyR- Rider Rating in parenthesis
when present.
Rider Rating
Explanation
I must admit that this part is something that I
added for my own personal use. It's based on Data Window research on the
tendencies of individual riders and changes periodically as I find the time to
update it. I'm not 100 percent convinced it belongs in the final program
version but there's no harm in leaving it in there for now. It often serves as
a guide. Not all plays are created equal and the presence of a superior rider
on a UDM play often points to a higher likelihood of cashing a bet than a
weaker rider does. I'll use a full rating as an example. If one or more
characters are missing from a rider rating it means the rider should be
considered neutral in that category.
Rating: (A++T)
Trainer character: Possible values are "A"
or simply left blank. The presence of an A indicates that one or more trainers
with a win percent greater than 20 percent have used this rider as a "go
to" rider in the recent past. If no trainer character is present, this
means that I haven't noticed this rider being used as a go to rider by a 20
percent trainer,
Sprint Dirt Rating. This is the first + or -
character. A plus indicates that this rider has historically outperformed a
normal expectation in sprint races in terms of both win rate and roi. A minus
indicates that the rider has historically underperformed.
Route Dirt Rating. This is the second + or -
character. A plus indicates that this rider has historically outperformed a
normal expectation in route races in terms of both win rate and roi. A minus
indicates that the rider has historically underperformed.
Turf Rating: This is the letter appearing to the
right of the dirt route rating. An upper case "T" indicates that this
rider has historically outperfornmed a normal expectaion both in terms of win
rate and roi in
Owner Name – This is an optional
setting. To display the owner name on the HTML Report, check the Display Owner
Name check box found in the System Settings/System Definitions Screen. Note:
the owner name is not shown on the screenshot above.
Below the frame displaying the data for the race are
two more numbers. From left to right, they are:
1. PaceIndex
2. Race Volatility (shown in bold)
Glossary of
Supported Factors
A complete glossary of all factors supported in
JCapper can be found on the JCapper website on the Supported Factors page.
Overlay
Highlighting
Another feature of the program is MLine Odds Ratio
II (MLOR2) highlighting on the HTML Report. This feature can be turned on or
turned off in the System Settings Interface/System Definitions Screen according
to individual user preferences. When turned on, if MLine Odds Ratio II is 1.30
or higher, the horse is highlighted in light yellow. When MLine Odds Ratio II
is 2.0 or higher, the horse is highlighted in very bright yellow. Only horses
that are program contenders are highlighted. The following horses in JCapper
are considered program contenders:
1. UDM Selections
2. JRating rank=1
3. JRating rank=2
4. CPace rank=1
No other horses will be highlighted.
Note: In newer non-JRating versions of JCapper the
following horses are subject to overlay highlighting:
1. UDM Selections
2. JPR rank=1
3. JPR rank=2
4. CPace rank=1
No other horses will be highlighted.
Note about
Printing the HTML Report and Overlay Highlighting using Internet Explorer
On most machines the Internet Explorer default
settings for printing of background colors are disabled. In JCapper Overlay
Highlighting on the HTML Report is achieved using a programming convention
called CSS (a Cascading Style Sheet.) JCapper uses CSS to set the
background-color attribute of the row to be highlighted. The browser then
interprets the background-color attribute and renders the row accordingly so
that you see the individual horse highlighted on your screen.
To enable Overlay Highlighting for HTML Reports
printed out on paper using Internet Explorer, the following setting(s) (as shown click here) must be enabled
in Internet Explorer:
Internet options, advanced tab.......check the box labeled
"print background
text and images"
Results
Display
JCapper*.DAT files are created by the Results File
Importer during a Database Build. This is a special file format containing both
past performance and results data. JCapper*.DAT files can be loaded into the
program just like HDW or Brisnet data files. After loading a JCapper*.DAT file,
after Calculating Races, odds, placings, and payoffs are displayed on the HTML
Report in blue font.
Factor
Rankings
The ranking of each horse relative to the field is
displayed for all numeric factors. A rank of (1) indicates the horse was the
ranked highest for that factor. A rank of (x) indicates the horse ranked 10th
or worse for that factor.
-end JCapper2008 example report -
UDM Display
Horses that match the criteria of any UDM Definition
are displayed in red font and will have a clickable + character just to the
left of the horse's name. When the + character is clicked, a hidden div
containing the names of all UDMs that selected this horse will be made visible
as shown above. After the hidden div has been made visible, clicking the +
character will hide it again.
+ALL Button
The +ALL Button is located at the very top of the
HTML Report Document. Clicking the +ALL Button will make the all of the hidden divs
containing the UDM Names for every UDM Selection on the HTML Report Document
visisble. One caveat though- you'll need to allow the report document enough
time to be completely loaded by the report viewer (or your browser) before all
of the hidden divs can be made visible. If you wait 10-15 seconds for the
document to load before clicking +ALL you should be fine.
-ALL Button
The -ALL Button is located at the very top of the
HTML Report Document. Clicking the -ALL Button will hide all of the hidden divs
on the HTML Report Document.
Print Button
The HTML Report document can be sent to the printer
by clicking the Print Button. The Print Button is located at the very top of
the HTML Report document.
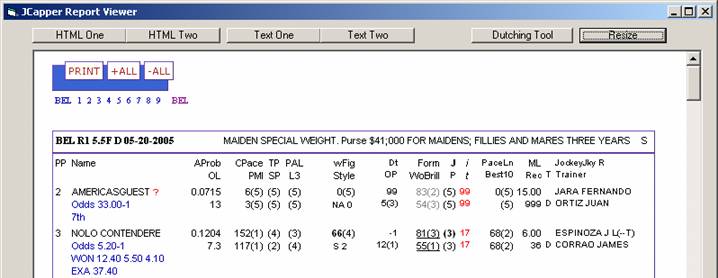
Figure 03 PRINT +ALL -ALL
Factor Bolding
The bolding represents a handful of combinations I was playing around
with at one time while considering whether or not to bring UDMs for them into
the program. The jury is still out on most of the concepts embodied by the
bolding and my intent was to simply remove it before the program's initial
release date. Individual users have asked me privately from time to time what
the bolding stood for. After explaining it, each asked me to leave it in place
so it's stayed where it is in its current format.
Here's an explanation of what gets bolded:
CPace
Bolded in Dirt Sprints Only
when CPace Rank =1
and when WoScore Rank = 1 or 2
Weighted Figure
Bolded when WoFit is True
note~ WoFit is true when a horse has had at least one fast
workout in the past 45 days. Otherwise, WoFit is false.
Form Rating
Bolded only when Form Rating itself is 100
JRating
Bolded when Class Rating Rank =1
and only when Class Rating Num > 0
Prime Power
Bolded when horse fits an energy/running style profile where
ClosingRatio is between 30 and 60
Morning Line
Morning Line Favorite is bolded
Beyond the
Basics- What to Look For
Playable/Unplayable
Races
JCapper's Race Volatility is a very powerful
predictor of the degree of difficulty the public will likely have in correctly
selecting the race winner. Here are some stats from calendar year 2004: In
races where Race Volatility was 50 or less, the post time favorite won in
excess of 50 percent of the time and the average win mutuel of the race winner
was right around $8.22.. In races where Race Volatility was 180 or higher, the
post time favorite won less than 28 percent of the time and the average win
mutuel was over $17.00. By avoiding races where Race Volatility is low, the
astute player can greatly enhance his or her chance of long term success. How
low is too low? It depends on the types of horses you play. Time spent at the
Data Window will very likely give you some good guidelines to go by.
UDM Selections
As mentioned earlier, horses that match the criteria
of any UDM Definition are displayed in red font. If you've done your homework
with the Data Window, your UDM Selections are those horses each day that you
should be focusing on.
Multiple UDMs
Selecting a Single Horse
As you get more experience with JCapper, you will
eventually start to create your own UDMs. Occasionally, multiple UDMs will
point out the same horse. Depending on the factor mix of the UDMs, this can be
a very powerful indicator of a situation that may warrant an increase in bet
size..
Highlighted
Horses
As mentioned earlier, another feature of the program
is Overlay Highlighting on the HTML Report. Highlighted horses are very likely
to be overlays. Be very aware of them at all times.
Track Biases
Track Biases can and do occur. Sometimes it pays to
be alert for them.
There are two types of biases.
1. Inner and Outer Rail Position Biases.
2. Running Style Biases
If the outside horses seem to be winning all the
races, you might consider playing an outside horse over an inside horse (and
vice versa.)
If all the races seem to be won on the front end,
you might want to consider playing top ranked CPace and PMI horses.
If all the races seem to be won by closers, you
might want to take a closer look at PAL and L3 horses.
Good Bet/Bad
Bet
Always insist on getting value before you wager. One
question you should not be asking
yourself before heading to the window: "Which horse is the winner in
here?" Instead you should be thinking: "Is this really a great bet?
Or should I be sitting on my hands here?" JCapper has some very good tools
for uncovering value. Time spent at the Data Window running single factors and
UDMs by AProbOL, PScore OL, various Divisors, various Odds Ranges, and various
Odds Ratios will eventually teach you something about the value of finding value
before you bet. Take advantage of the tools found in JCapper designed for play
or pass decision making.
A Very Blatant
Example
SMUGGLERS RUN
$56.80
Figure 01 (above) R5 Santa Anita on
Note Race Volatility for the race: 180. This
indicates a very playable race with a contentious field. Note that the 8 horse
SMUGGLERS RUN is a UDM selection having been selected by the Out of the Box UDM
(DS_JCapper_OOB) that comes with the program. Note that SMUGGLERS RUN is also
highlighted in bright yellow. This indicates a MLine Odds Ratio II that is at
least double the program's AProbOL of 5-1, a very strong indicator that this
horse will be overlooked by the public in the wagering. SMUGGLERS RUN won this
race and paid $56.80 to win. The place horse, HAINT YOU GRAND was ranked 1st in
TPace. Exacta players might be interested to learn that the exacta paid
$597.20.
A Rather Good
Example
WHIZBANG
$30.80
Figure 02 (above) R5
Note that the 6 horse WHIZBANG is a UDM selection having
been selected by the Out of the Box UDM (DS_JCapper_OOB) that comes with the
program as well as six other UDMs. The six other UDMs are of my own creation.
The point I'd like to make here is horses selected by multiple UDMs should
never be taken lightly.
Note that WHIZBANG is also highlighted in bright
yellow. This indicates a MLine Odds Ratio II that is at least double the
program's AProbOL of roughly 5-2, a very strong indicator that this horse will
be overlooked by the public in the wagering. WHIZBANG ran away with this race
and paid $30.80 to win. The place horse, FEAR THE CAPE was ranked 3rd in
JRating. Exacta players might be interested to learn that the exacta paid
$202.50.
Another Very
Blatant Example
ISLAND LORE
$100.80
Figure 04 (below) R10 Gulfstream on
There were no Out of the Box UDM Selections for this
race. But focus your attention on the #3 horse ISLAND LORE. ISLAND LORE has the top JRating for the race
and was sent to post at odds of 49.40 to one. Race Volatility for this race,
like the previous example, is a healthy 180. This is indicative of a
contentious and possibly playable race. ISLAND LORE won this race and paid
$100.80 to win. There was a dead head for second between OBERONS GIRL and TIGER
FEVER. The $433.40 exacta to TIGER FEVER may have been gettable for exacta
players. TIGER FEVER was ranked 1st in CPace, TPace, WoBrill, and Form.
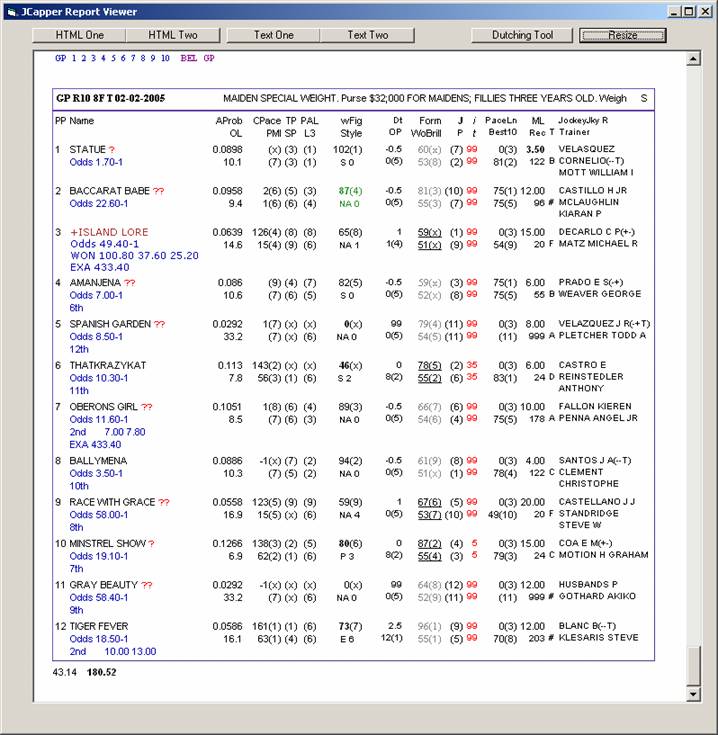
Figure 04 GPX R10
It Happened
Again (12 days later)
SUMMER TONE
$113.80
Figure 05 (below) R10 Gulfstream on
There were no Out of the Box UDM Selections for this
race. But I’d like to bring focus to just one horse: The #2 SUMMER TONE. With
the top JRating for the race and sent to post at odds of 55.90 to one, this horse
immediately gets my full attention as an overlay. Note that Race Volatility for
this race is a healthy 154. This is again indicative of a contentious and
possibly playable race. What happened in this race? SUMMER TONE won the race
and paid $113.80 to win. I had to do a double take when I looked at this race
because for a moment I thought I was looking at the exact same race shown in
the previous example. The 13 horse, ARRANGEMENT, finished second. Was the
$780.20 exacta gettable in here? ARRANGEMENT ranked second in Bris Prime Power.
Personally, I missed the exacta in here and had to "settle" for the
win.. Oh well, hindsight is golden.
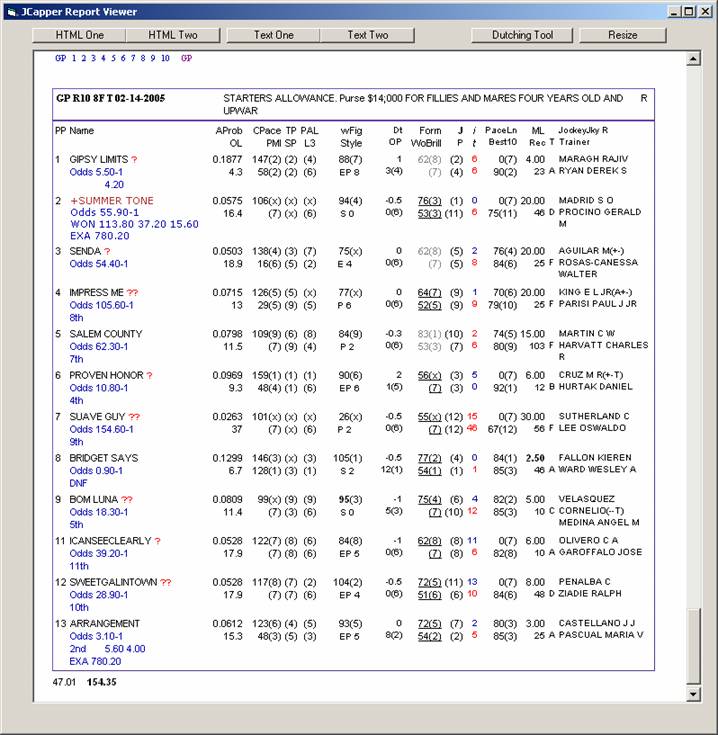
Figure 05 GPX R10
Let’s do another one. Fast forward almost one full
year to
1. MIESQUES APPROVAL has the
top JRating in the race.
2. MIESQUES APPROVAL was picked
up by Overlay Highlighting.
3. MIESQUES APPROVAL was 50-1
on the tote board.
4. The above three things spell
OVERLAY.
What happened in this race? MIESQUES APPROVAL won
the race under a flawless ride from Eddie Castro spoiling Jerry Bailey’s
retirement party in front of a national television audience and paid $99.60 to
win.
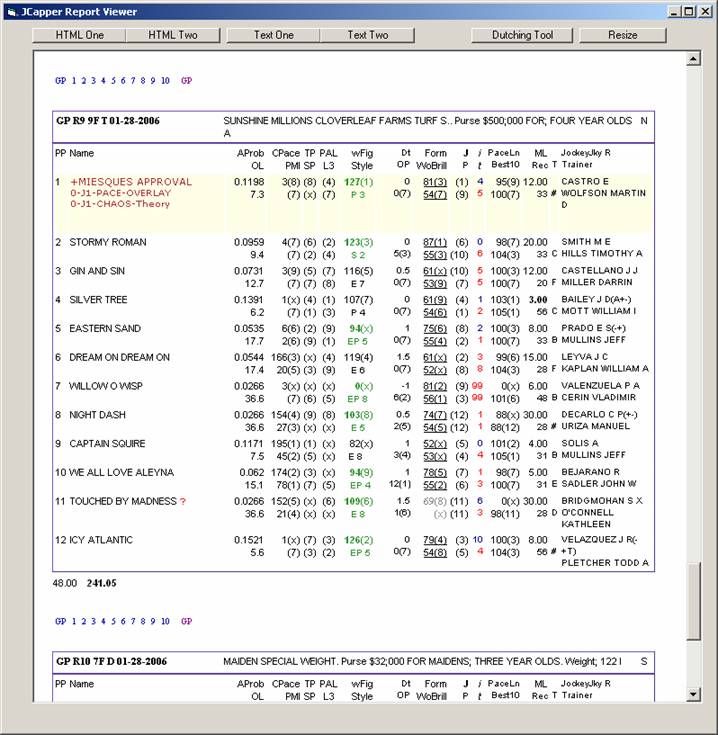
Figure 06 GPX R9
I wanted to add a couple of screenshots of the
JCapper2007 HTML Report. The first race shown is R1 from
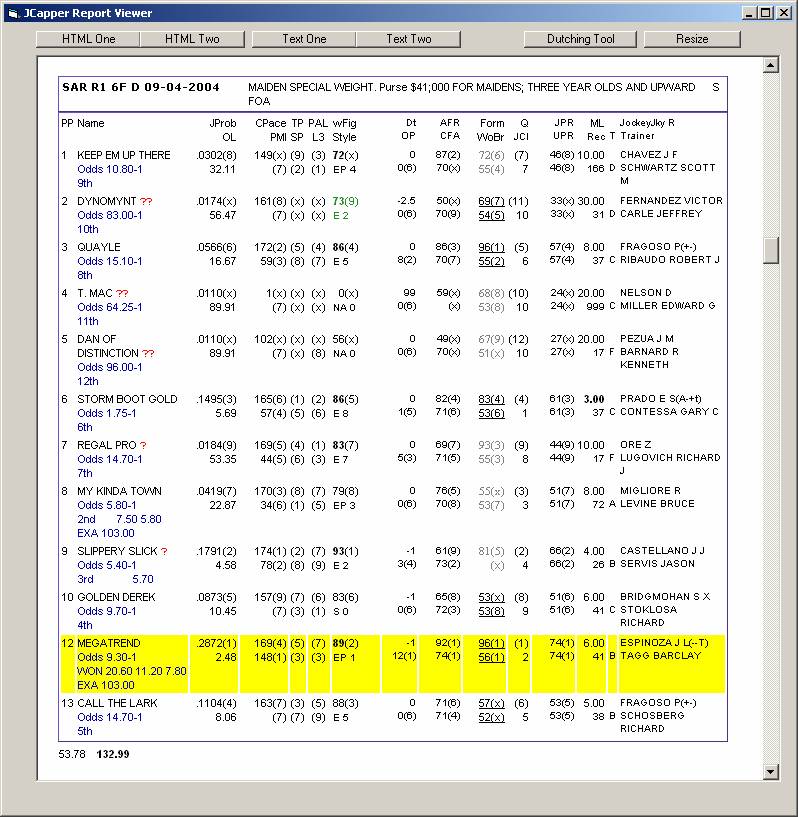
Figure 07 SAR R1
This next race is R5 from
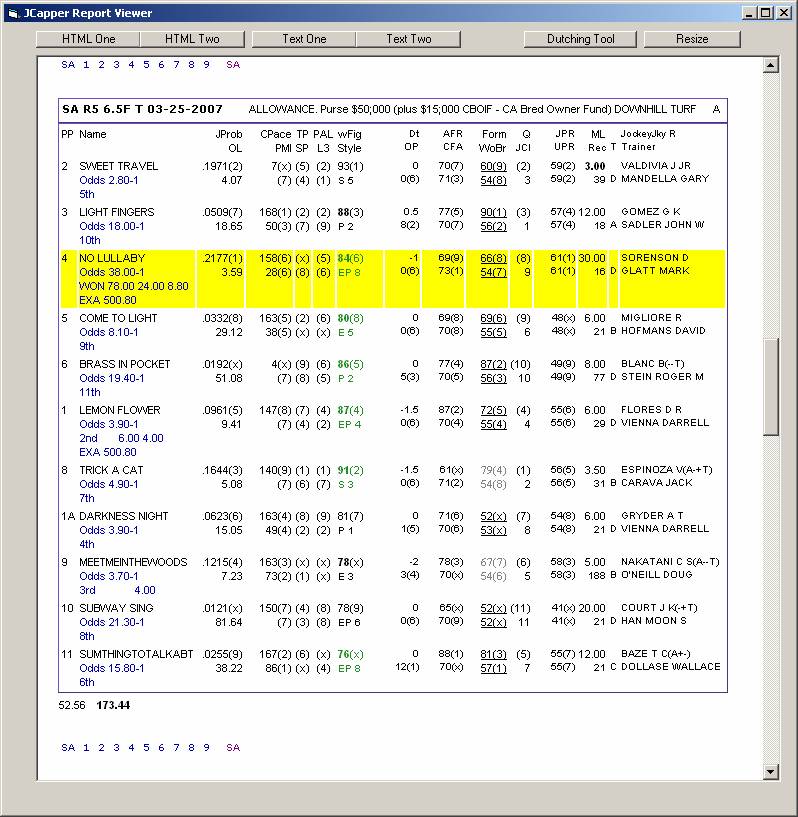
Figure 08 SAX R5
Bombs like these don't come along every day. Far
more common are logical choices that pay between $9.00 and $16.00 to win. But
when the public looks the other way on very gettable horses, in playable
contentious races, and the gettable horses are overlooked by the Morning Line
Odds Maker as well, chances are you are staring at a great bet.
Reports Generated in JCapper by Calc
Races Routines
The HTML Report is not the only report available in
JCapper. The following section describes all of the JCapper reports (as of
HTML Report One - (Filename: Report_1.html) The JCapper HTML Report shows the
significant factors with numbers and rankings for every horse in an easy to
follow format. All potential UDM plays are highlighted for easy identification.
There are hyperlinks so that the user can freely navigate from track to track
and race to race. HTML Report One contains information for every race found in
all loaded race card files and is created whenever a standard Calc Races
routine is run using the Calculate Races button.
HTML Report Two - (Filename: Report_2.html) This JCapper HTML Report is exactly
the same as HTML Report One except that it contains information for a single
track only and is created whenever a Calc Races is run for a selected single
track only.
Text Report One - (Filename: AtAPrice.txt) The JCapper Text Report shows all UDM
Plays for the day neatly organized in one place. Here you'll find a header for
each race that contains the Track, Race Number, Surface and Distance, and the
class descriptor and RaceVolatility
for the race. All potential positive expectation UDM plays in each race are
laid out for you. Here you'll find post position, name of horse, name of rider,
name of trainer, the name of the UDM that the horse qualifies for, morning line
odds, and finally, the BettingInstructions
from the UDM definition are shown in brackets. Seeing this report leaves very
little doubt as to what horse(s) should be played or at what odds. It's right there in a very easy to follow
format. Text Report One contains information for all horses that qualify as
potential UDM plays in every race found in all loaded race card files and is
created whenever a standard Calc Races routine is run using the Calculate Races
button.
Text Report Two - (Filename: AtAPrice2.txt) This JCapper Text Report is exactly
the same as Text Report One except that it contains information for a single
track only and is created whenever a Calc Races is run for a selected single
track only.
CSV File One – The JCapper Calc Races
routine also creates a comma delimited CSV file designed for use in third party
spreadsheet products such as Microsoft Excel. The filename is Plays.CSV and can
be found on the Default Data Folder. The information found in this file is
similar to that found in the Text Report file. The major advantage of using the
CSV Report file over a Text Report is that races can be sorted in post time
order. The user also has the ability to rename the file and permanently save
it. Advanced users have used this file as a starting point and have added
custom fields to their own XLS for the specific purpose of tracking betting
results from live play.
CSV File Two – This CSV file is exactly
the same as CSV File One except that it contains information for a single track
only and is created whenever a Calc Races is run for a selected single track
only.
Daily Export Files – The JCapper Calc Races
routine also creates the following comma delimited text files:
1. ForBill.TXT- This file contains information about each horse and includes
rankings, numeric values, and gaps for hundreds of JCapper factors. Some
advanced users use this file as a data source for their own custom handicapping
programs.
2. ForBill2.TXT – This file is exactly the same as ForBill.TXT except that it contains
information for a single track only and is created when a Calc Races routine is
run for a single track only.
3. ForJeff.TXT – This file contains all the information found in the ForBill.TXT
file. In addition, those horses that are found by the Profile Marker to fit
active UDM Definitions are “marked” with mark
characters. Again, some advanced users use this file as a data source for
their own custom handicapping programs.
4. ForJeff2.TXT - This file is exactly the same as ForJeff.TXT except that it contains
information for a single track only and is created when a Calc Races routine is
run for a single track only.
This section covers JCapper Silver Reports, and was added to this Help Doc on 11-14-2020.
JCapper Silver HTML Report - Playlist File Mode
The JCapper Silver Playlist File Mode HTML Report shown below is for Belmont R9 on 09-12-2015.
The following "Key" contains column headers as they appear (left to right) on the report along with the factor displayed in each column:
-------------	--------------------------------------------------------------------------------------
Column Header	Factor
-------------	--------------------------------------------------------------------------------------
           PP   Saddle cloth number/ betting interest identifier
         Name   Name of horse
-------------	--------------------------------------------------------------------------------------
        UProb   UPRMLProb = a probability estimate generated using SilverRating and morning line odds
           OL   Odds Line = ((1/UPRMLProb) - 1)
-------------	--------------------------------------------------------------------------------------
        CPace   CPace numeric value (rank in parenthesis)
         EaCN   EarlyConsensus numeric value (rank in parenthesis)
     E1(gray)   CompoundE1 numeric value (rank in parenthesis)
     E2(gray)   CompoundE2 numeric value (rank in parenthesis)
-------------	--------------------------------------------------------------------------------------
           TP   TPace rank - click to see numeric value
           SP   SustainedPace rank - click to see numeric value
     AP(gray)   CompoundAP rank - click to see numeric value
     SP(gray)   CompoundSP rank - click to see numeric value
-------------	--------------------------------------------------------------------------------------
          PAL   Pace Adjustsed Late rank - click to see numeric value
           L3   Late Pace rank best of last 3 - click to see numeric value
           CL   CompoundLate rank - click to see numeric value
           TT   Compound Turn Time rank - click to see numeric value
-------------	--------------------------------------------------------------------------------------
         WFig   Weighted Figure numeric value (rank in parenthesis)
        Style   HDW Run Style - with tic mark and ALT QSpeedPoints
         PctE   PercentEarly numeric value (rank in parenthesis)
         PFit   CompoundPaceFit numeric value (rank in parenthesis)
        LSlnt   Late Slant Fig numeric value (rank in parenthesis)
        HType   HorseType
-------------	--------------------------------------------------------------------------------------
        MLOR5   Morning Line Odds divided by UPRMLProb Odds Line
          QSP   QSpeedPoints (rank in parenthesis)
          PED   HDW Distance Pedigree Rating (rank in parenthesis)
           DT   Distance Shift
-------------	--------------------------------------------------------------------------------------
          AFR   Advanced Form Rating numeric value (rank in parenthesis)
          CFA   Competitive Figure Ability numeric value (rank in parenthesis)
-------------	--------------------------------------------------------------------------------------
         Form   FormRating numeric value (rank in parenthesis)
         WoBr   Workout Brilliance numeric value (rank in parenthesis)
-------------	--------------------------------------------------------------------------------------
          SOR   Race Strength rank - click to see numeric value
          PSR   HDW Projected Speed Rating rank - click to see numeric value
-------------	--------------------------------------------------------------------------------------
        PwrCN   PowerConsensus numeric value (rank in parenthesis)
   UPR/Silver   Silver Rating numeric value (rank in parenthesis)
-------------	--------------------------------------------------------------------------------------
           ML   Morning Line Odds
          Rec   Recent Activity Days Last Start
            T   Grade for Trainer (IGNORE THIS! It's out of date!)
-------------	--------------------------------------------------------------------------------------
       Jockey   Jockey Name
      Trainer   Trainer Name
-------------	--------------------------------------------------------------------------------------
JCapper Silver HTML Report - SQL Mode
About SQL Mode HTML Reports:
Unlike the report layout of the playlist file mode html report (which is "canned" or "hard coded" into the program) - the SQL Mode HTML Report Layout can be customized by the user.
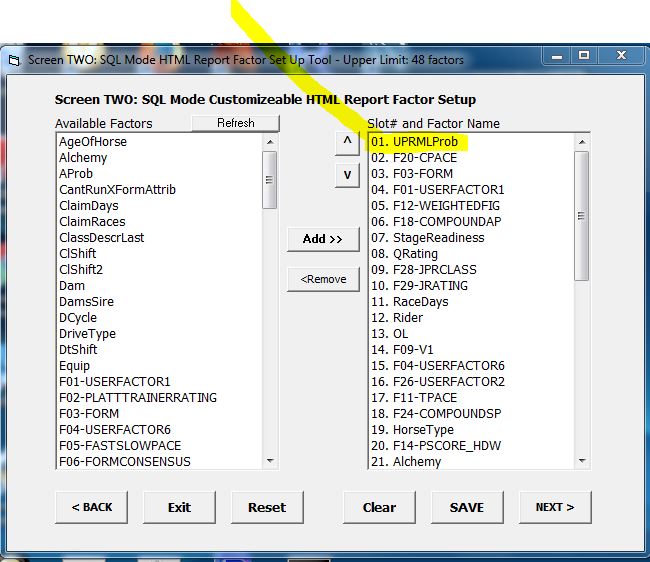
The Silver SQL Mode HTML Report presented below does contain one added customization:
Prior to generating the report, I brought up the Factor Setup Tool. On Screen Two I removed JPRMLProb from slot #01 and replaced it with UPRMLProb.
I did this because JPR is not supported in JCapper Silver. In JCapper Silver SilverRating is the supported power rating and SilverRating and UPR are one and the same thing.
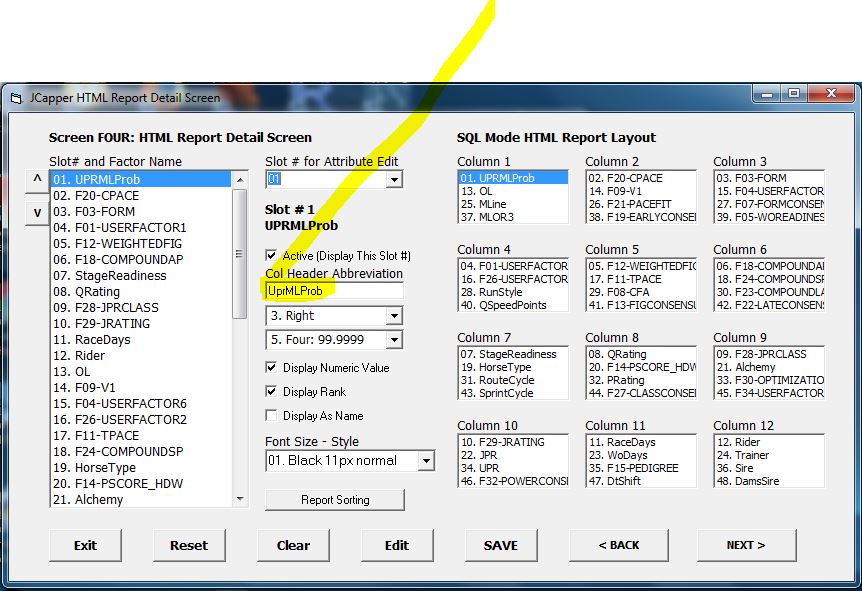
From there, while still on Screen Two I hit the Save button and kept hitting the Next button until I came to the Deatil Screen.
Then, in the Detail Screen I highlighted slot 01 in Column1 on the report layout and changed the column header text from JPRProb to UPRProb and hit the Save button.
At that point (with the one customization I wanted to do for this post out of the way) I x-ed out of the Factor Setup Tool, used Scratch Bot to parse the XML, verified that there were a few early scratches for BEL, and went into the User Sys Defs Screen where I checked the box to operate JCapper in SQL Mode, hit the Save button, x-ed out of the User Sys Defs Screen - and ran a SQL Mode Calc Races for BEL R9 to generate the linked to report.
Screenshots:
Here:
And here:
--Note:
Here's a link to the the Factor Setup Tool Help Doc which is a 4 part web tutorial that covers changing the SQL Factor Setup and HTML Report Layout in far more detail than what I've written above:
http://www.jcapper.com/Article_AddJRating.html
Okay, with that bit of background info out of the way, here's what the SQL Mode JCapper Silver HTML Report for BEL 09-12-2015 R9 looks like:
The following "Key" contains column headers as they appear (left to right) on the report along with the factor displayed in each column:
-------------	--------------------------------------------------------------------------------------
Column Header	Factor
-------------	--------------------------------------------------------------------------------------
           PP   Saddle cloth number/ betting interest identifier
         Name   Name of horse
-------------	--------------------------------------------------------------------------------------
      UPRProb   UPRMLProb = a probability estimate generated using SilverRating and morning line odds
           OL   Odds Line = ((1/UPRMLProb) - 1)
           ML   Morning Line Odds (rank in parenthesis)
        MLOR3   Morning Line Odds divided by UPRProb Odds Line (I really should have changed the
                column header text for this from MLOR3 to MLOR5 before posting.)
-------------	--------------------------------------------------------------------------------------
        CPace   CPace numeric value (rank in parenthesis)
          PMI   PMI num val (rank in parenthesis) shown as 0's because PMI not supported in Silver
                Silver users would use the Setup Tool to display an alternate factor in this slot

         PFit   CompoundPaceFit numeric value (rank in parenthesis)
         EaCN   EarlyConsensus numeric value (rank in parenthesis)
-------------	--------------------------------------------------------------------------------------
          AFR   Advanced Form Rating numeric value (rank in parenthesis)
         Form   Form Rating numeric value (rank in parenthesis)
       WBrill   Workout Brilliance numeric value (rank in parenthesis)
        FmCn    Form Consensus numeric value (rank in parenthesis)
-------------	--------------------------------------------------------------------------------------
	 WFig   Weigthed Figure numeric value (rank in parenthesis)
        TPace   TPace numeric value (rank in parenthesis)
          CFA   CFA numeric value (rank in parenthesis)
         FgCn   Fig Consensus numeric value (rank in parenthesis)
-------------	--------------------------------------------------------------------------------------
          PAL   Pace Adjustsed Late rank - click to see numeric value
           L3   Late Pace rank best of last 3 - click to see numeric value
         CpLt   CompoundLate rank - click to see numeric value
         LtCn   Late Consensus rank - click to see numeric value
-------------	--------------------------------------------------------------------------------------
         Rstr   Race Strength numeric value (rank in parenthesis)
          Ped   HDW Distance Pedigree Rating rank - click to see numeric value
         PCls   PClass numeric value (rank in parenthesis)
         ClCn   Class Consensus numeric value (rank in parenthesis)
-------------	--------------------------------------------------------------------------------------
           OP   OptPts num val (rank in parenthesis) shown as 0's because OptPts not supported in Silver
                Silver users would use Setup Tool to display an alternate factor in this slot

          Stg   Stage Readiness - shown as 0's because factor not supported in Silver
                Silver users would use Setup Tool to display an alternate factor in this slot

           RC   RouteCycle (1=yes 0=no)
         CRun   CantRunXFormAttribute (0=clean 1=dirty 2=cantrun)
-------------	--------------------------------------------------------------------------------------
       RStyle   HDW RunStyle (upper/lower case with tic marks)
         QSpd   QSpeedPoints
          Yrs   AgeOfHorse
          Sex   Sex of horse
-------------	--------------------------------------------------------------------------------------
         FCyc   JCapper Form Cycle (1-8)
          Rec   Recent Activity Days Last Start
           Wo   Recent Activity Days Last Work
           DT   Distance Shift
-------------	--------------------------------------------------------------------------------------
          JPR   JPR num val (rank in parenthesis) shown as 0's because JPR not supported in Silver
                Silver users should use Setup Tool to display an alternate factor in this slot

          UPR   SilverRating numeric value (rank in parenthesis)

          ALC   Alchemy num val (rank in parenthesis) shown as 0's factor not supported in Silver
                Silver users should use Setup Tool to display an alternate factor in this slot

         PwCn   Power Consensus numeric value (rank in parenthesis)
-------------	--------------------------------------------------------------------------------------
          CXN   Connection Rating rank - click to see numeric value
          Jky   Rider Win Pct
          TNR   Trainer Win Pct
          Drv   Drive Type
-------------	--------------------------------------------------------------------------------------
         Sire   Name of Sire
        Rider   Jockey Name
      Trainer   Trainer Name
          Dam   Name of Dam
-------------	--------------------------------------------------------------------------------------
Happy Hunting and Good Luck,
-jp
.