Data Window Exports
Author: Jeff Platt
Date Last Modified: 11-14-2015
General Overview
The JCapper Data Window has some very powerful functionality for getting at your Data. You can use the ALL button with various drop down settings to see the historical performance of individual factors under a wide variety of different conditions. You can create UDMs and run them through the Data Window to see the historical performance of almost limitless combinations of factors under targeted conditions.
The more you work with the Data Window the more you learn about the game. And as you learn you’ll very likely discover one thing: there really is a lot to learn about this game. Researching the performance of hundreds of handicapping factors and the almost unlimited ways they can be used is time consuming to say the least. Key areas of interest expressed by many talented user-players happens to be (for good reason) in using the Data Window to discover Track Profile information and the abilities and performance of trainers, riders, and owners.
The idea behind Data Window Exports is to reduce the amount of R&D time required to get a workable understanding of this game.
Jeff’s Track Profile Export
General Overview
One thing I’ve always done as a horseplayer is maintain separate track profiles for each surface and distance where I play. I’m a firm believer that until I know where most of the winners are coming from I have no business playing a given track or circuit. The records I keep of my own live play continually reinforce the value of understanding the demands of the track – and going with the grain - not against it. If I don’t have a clear understanding of a track - what is winning and why - I simply will not play there.
If the prevailing pattern for 6f dirt sprints at my favorite track is that the races are being won by E run style horse with top CPace numbers who are racing on or near the lead, then I don’t want to back horses that lack the ability to go to the front. When early speed is dominant I will adjust my UDMs to reflect the demands of the track. In the early 1980’s I meticulously kept track profiles by hand. Later, in the 90’s I did them in Excel. Finally in June of 2008, I decided to create a Data Window Export so that I (and others) could do them entirely from within JCapper. The Jeff’s Track Profile Export you’ll find in JCapper mimics exactly the format of my own Excel Spreadsheet.
Running Jeff’s Track
Profile Export
Running a Data Window Jeff’s Track Profile Export is a two step process:
- Activate the Track Profile Export by selecting it from the MENU in the Data Window. This toggles the Export “On.”
- Run a Data Window query. This actually “runs” the Export. Whatever races are returned by the query you run after toggling the Export “on” – data for the race winners of those races is written to the table named Export2 in the JCapper2.mdb file found in the c:\JCapper\Exe folder.
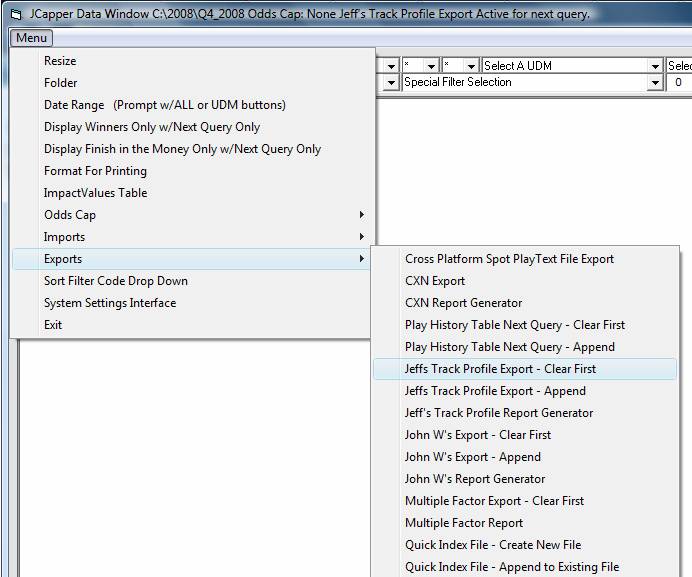
The screenshot below shows the Data Window MENU items for JCapper2008 (as of Jan 2009.) The user has already selected Jeff’s Track Profile – Clear First. Look at the title bar running across the top of the Data Window. When an export has been activated you will see text describing the type of Export that you are about to run. The Export at this point is activated. From here, to run the Export, simply click the ALL button and open a PlayList File. The Data Window will run the export while it runs your query. Once the query has finished and you see results displayed in the Data Window’s textbox your Export is complete. Export data will be sitting in the export table.
Clear First Option
When the user clicks MENU and selects an Export with the Clear First option, all data sitting in the export table for the selected Export is cleared prior to the Export being run. As the Export is run fresh data matching the Data Window query being run by the user is added to the table. The end result: The data sitting in the export table after the Export has been completed is an exact match of those starters returned by the Data Window query run by the user to drive the Export.
Append Option
When the user clicks MENU and selects an Export with the Append option, all data sitting in the export table prior to the Export being run is left untouched. As the Export runs fresh data matching the Data Window query being run by the user is added to the table. The end result: The data sitting in the export table after the Export has been completed is a combination of whatever data happened to be sitting in the table AND those starters returned by the Data Window query run by the user to drive the Export.
Design
The design of the Data Window’s Export functionality is simple. While running a query, if the user has Activated an Export, the Data Window will write exported data to an Access table. Working outside of JCapper, the user can use Access to get at the data in the Export table(s.) He can create queries, custom reports, and even manipulate the data and perform number crunching to generate custom factors and odds lines.
Viewing Reports
Viewing a Report is easy. Click MENU and select the appropriate Report Generator. Then use the drop downs, checkboxes, and buttons found on the Report Generator to build and run your report.
Jeff’s Track Profile Report
Generator
Launch Jeff’s Track Profile Report Generator by clicking MENU and then selecting the Jeff’s Track Profile Report Generator menu item. I’ve tried to make the Report Generator itself idiot proof. When first started the buttons on the Report Generator will be disabled. The buttons become enabled once the user selects enough options from the drop downs to create a valid report. To create a valid report, select Track, Distance, Surface, Track Condition, and Date Restriction. Once you have done that the Generate Report Button becomes enabled. Clicking the Generate Report Button will cause the Report Generator to query the data sitting in the export table, match it against your selections for Track, Distance, Surface, Track Condition, and Date Restriction and create an HTML Report file named JeffsTrackProfileReport.html on your Default Data Folder. The report file can then be viewed by opening it in a web browser or clicking the View Report Button on the Report Generator.
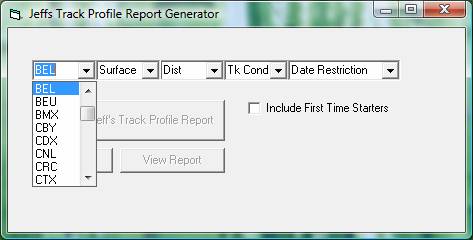
The above screenshot shows the Report Generator upon startup. The Track Drop Down is opened and I am about to select BEL as the track. The Generate Report Button is still disabled because I haven’t yet made selections for Distance, Surface, Track Condition, or Date Restriction.
After selecting BEL as my track, S (sprints) as my distance, D (dirt) as my surface, FT as my track condition, and 15 days as my date restriction, the Generate Report Button became enabled. I clicked it and generated a Track Profile Report for BEL dirt sprints on a fast track run within the past 15 calendar days. Here is what the report itself looks like:
http://www.jcapper.com/2008/JeffsTrackProfileReport_DS_BEL_FT.html
Reading the Track
Profile Report
The easiest best use of Track Profile Reports, in my opinion, is using them to get a quick understanding of track profile. If races at a certain surface-distance category are being won on the front end I want to know about it. Likewise, if closers are dominating an individual surface-distance category, I want to know about that too.
In the above report, take a look at the summary columns at the bottom of the report for both CompoundAP and CompoundSP. The average winning rank for CompoundAP is 1.89. Compare that to the average winning rank for CompoundSP of 2.44. For the races detailed in the report CompoundAP is stronger than CompoundSP. Put another way, average pace is more important in this track profile than sustained pace. Summarized: Early pace for this track profile is stronger than late pace.
These reports were designed to let you know that at a glance.
Notes: The source export table for Jeff’s Track Profile Report is the table named Export2 in the JCapper2.mdb file found in the c:\JCapper\Exe folder. The selections in the Report Generator’s drop downs for Distance, Surface, Track Condition, and Date Restriction are populated at start up time from whatever data happens to be sitting in the export table. If no selections in the drop downs are visible it means that you do not have data sitting in the export table and you need to run an Export. If you use the Data Window to run another export, you can repopulate the Report Generator’s drop downs without closing and restarting the Report Generator by clicking the Reset Button. Like all of the drop downs in JCapper, the drop downs in the Report Generator respond to keystrokes.
--- end section for
Jeff’s Track Profile Reports ---
CXN Exports
General Overview
The Data Window’s CXN Exports were specifically designed to export trainer, rider, and owner data to the CXNSummary table in the c:\JCapper\Exe\JCapper2.mdb file. The companion CXN Report Generator uses the exported data as its source for a variety of trainer, rider, and owner reports. Running a CXN Export is very much like running a Build Database on a PlayList File. One of the best things about CXN Exports is time savings. Running an Export and then using the Report Generator to run trainer reports is far faster than running hundreds of individual trainers through the Data Window one at a time. For example, the Overlooked Trainers Report, Talented Trainers Report, or the Souper Trainers Report (yes I purposely spelled it that way) can give you data on any number of trainers who have historically outperformed the take broken out by a variety of different categories. Simply reading these reports should give you plenty of ideas for creating Trainer UDMs.
Launching the CXN
Export Module
To launch the CXN Export Module:
1. From the Data Window Click MENU
2. Select the Data Window Menu, click Exports
3. Select CXN Export – This will launch the CXN Export Module
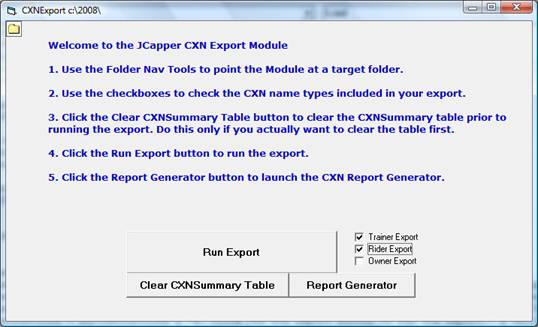
Screenshot: The CXN Export Module - Note: The user has selected Trainers and Riders.
Running a CXN Export
To run a CXN Export:
1. Use the Folder Nav Tools to point the Module at a Target Folder.
2. Use the checkboxes to indicate the CXN Name Types to be included in your export.
3. Click the Clear CXNSummary Table button to clear the CXNSummary table prior to running the Export. Do this only if you actually want to clear the table first.
4. Click the Run Export Button. Select and open a PlayList or QuickIndex File. This actually “runs” the Export. The Module will compile summary data for the name types selected in step two for whatever records exist in the selected PlayList or QuickIndex File and write that data to the CXNSummary table in the JCapper2.mdb file in the c:\JCapper\Exe folder.
To Clear or not to
Clear:
Perform step 3 when you want the CXNSummary table to contain data for one PlayList or QuickIndex File only. When you perform step 3, the CXNSummary table is cleared before the Export is run. When the Export is complete, data sitting in the CXNSummary table will match data from the PlayList or QuickIndex file selected in step 4.
Omit step 3 when you want the CXNSummary table to contain data spanning multiple PlayList or QuickIndex Files. When you omit step 3, the CXNSummary table is not cleared before the Export is run. While the Export is run data matching the PlayList or QuickIndex file selected in step 4 is added (appended) to data that was already present in the CXNSummary table prior to running the Export.
Launching the CXN
Report Generator
To launch the CXN Report Generator:
- From the CXN Export Module click the Report Generator button.
-or-
- From the Data Window Menu, select Exports and then select CXN Report Generator.
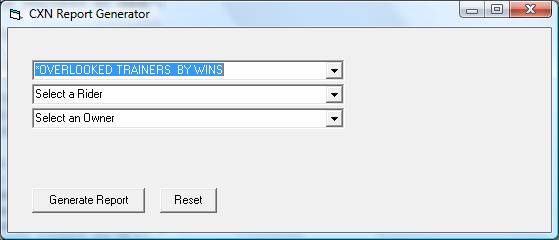
Screenshot: The CXN Report Generator - Note: The user has selected the Overlooked Trainer Report (sorted by wins.)
Generating CXN
Reports
To generate a report:
- Select a report from one of the drop downs.
- Click the Generate Report Button.
When the CXN Report Generator is first started the Generate Report button is disabled. The button becomes enabled once the user selects a report from one of the drop downs. In the screenshot shown above the user has selected a report named Overlooked Trainers by Wins. Clicking the Generate Report button will cause the Module to create a file named CXNReport.html in the user’s Default Data Folder. Once report generation is complete the file will pop open in the Module’s Report Viewer. The report itself looks like this:
Basic Report Types
Three basic report types are available:
- Trainer Reports
- Rider Reports
- Owner Reports
Trainer Reports
Trainer Reports are available from the Trainer Reports Drop Down. Select a report from the drop down and click the Generate Report button. As of this writing the following trainer reports are available:
- ALL TRAINERS – This report contains all trainers in the table. The following options are available: sort by name, pct, roi, and wins.
- OVERLOOKED TRAINERS – This report contains data for only those trainers in the table who are considered overlooked. The following options are available: sort by name, pct, roi, and wins. For purposes of the report a trainer is considered overlooked if his or her record meets the following criteria: roi >= .85.
- TALENTED TRAINERS - This report contains data for only those trainers in the table who are considered talented. The following options are available: sort by name, pct, roi, and wins. For purposes of the report a trainer is considered talented if his or her record meets the following criteria: wins >= 5 AND roi >= 1.00.
- SOUPER TRAINERS – This report contains data for only those trainers in the table who are considered souper. The following options are available: sort by name, pct, roi, and wins. For purposes of the report a trainer is considered souper if his or her record meets the following criteria: wins >= 20 AND pct >= .25 AND roi >= 1.00. Note: yes I purposely spelled it that way.
- OFF TRACK TRAINERS WORTH MENTIONING – This report contains data for only those trainers whose runners have performed well on off tracks. The criteria for this report is: roi >= .95 for off track starters. The report is sorted by OffTrackWins.
- TURF TRAINERS WORTH MENTIONING – This report contains data for only those trainers whose runners have performed well on turf. The criteria for this report is: roi >= .95 for turf starters. The report is sorted by TurfWins.
- FTS TRAINERS WORTH MENTIONING – This report contains data for only those trainers who have done well with first time starters. The criteria for this report is: roi >= .95 for first time starters. The report is sorted by FTSWins.
- OFF THE CLAIM TRAINERS WORTH MENTIONING – This report contains data for only those trainers whose runners have performed well first start off the claim. The criteria for this report is: roi >= .95 first start off the claim. The report is sorted by ClaimWins.
- CPACE123 TRAINERS WORTH MENTIONING – This report contains data for only those trainers whose starters have done well when ranked 1st, 2nd, or 3rd in JCapper CPace. The criteria for this report is: roi >= .95 for starters ranked 1st, 2nd, or 3rd in JCapper CPace. The report is sorted by CPace123Wins.
- COMPOUNDLATE123 TRAINERS WORTH MENTIONING – This report contains data for only those trainers whose starters have done well when ranked 1st, 2nd, or 3rd in JCapper CompoundLate. The criteria for this report is: roi >= .95 for starters ranked 1st, 2nd, or 3rd in JCapper CompoundLate. The report is sorted by CompoundLate123Wins.
- INDIVIDUAL TRAINER – The drop down also contains all trainer names found in the table. To run a report for an individual trainer simply select the desired name from the drop down and click the Generate Reports Button.
Rider Reports
Rider Reports are available from the Rider Reports Drop Down. Select a report from the drop down and click the Generate Report button. As of this writing the following rider reports are available:
- ALL RIDERS – This report contains all riders in the table. The following options are available: sort by name, pct, roi, and wins.
- OVERLOOKED RIDERS – This report contains data for only those riders in the table who are considered overlooked. The following options are available: sort by name, pct, roi, and wins. For purposes of the report a rider is considered overlooked if his or her record meets the following criteria: roi >= .85.
- TALENTED RIDERS - This report contains data for only those riders in the table who are considered talented. The following options are available: sort by name, pct, roi, and wins. For purposes of the report a rider is considered talented if his or her record meets the following criteria: wins >= 5 AND roi >= 1.00.
- OFF TRACK RIDERS WORTH MENTIONING – This report contains data for only those riders who have performed well on off tracks. The criteria for this report is: roi >= .95 for off track mounts. The report is sorted by OffTrackWins.
- TURF RIDERS WORTH MENTIONING – This report contains data for only those riders who have performed well on turf. The criteria for this report is: roi >= .95 for turf mounts. The report is sorted by TurfWins.
- FTS RIDERS WORTH MENTIONING – This report contains data for only those riders who have done well riding first time starters. The criteria for this report is: roi >= .95 for first time starter mounts. Unusual? Yes. This can be a very interesting category with a limited number of worthwhile plays. The report is sorted by FTSWins.
- OFF THE CLAIM RIDERS WORTH MENTIONING – This report contains data for only those riders whose records indicate success riding for trainers first start off the claim. The criteria for this report is: roi >= .95 first start off the claim. The report is sorted by ClaimWins.
- CPACE123 RIDERS WORTH MENTIONING – This report contains data for only those riders who have done well riding mounts ranked 1st, 2nd, or 3rd in JCapper CPace. The criteria for this report is: roi >= .95 for starters ranked 1st, 2nd, or 3rd in JCapper CPace. The report is sorted by CPace123Wins.
- COMPOUNDLATE123 RIDERS WORTH MENTIONING – This report contains data for only those riders whose starters have done well when ranked 1st, 2nd, or 3rd in JCapper CompoundLate. The criteria for this report is: roi >= .95 for starters ranked 1st, 2nd, or 3rd in JCapper CompoundLate. The report is sorted by CompoundLate123Wins.
- INDIVIDUAL RIDER – The drop down also contains all rider names found in the table. To run a report for an individual rider simply select the desired name from the drop down and click the Generate Reports Button.
Owner Reports
Owner Reports are available from the Owner Reports Drop Down. Select a report from the drop down and click the Generate Report button. As of this writing the following owner reports are available:
- ALL OWNERS - This report contains all owners in the table. The following options are available: sort by name, pct, roi, and wins.
- OVERLOOKED OWNERS – This report contains data for only those owners in the table who are considered overlooked. The following options are available: sort by name, pct, roi, and wins. For purposes of the report an owner is considered overlooked if his or her record meets the following criteria: roi >= .85.
- TALENTED OWNERS – This report contains data for only those owners in the table who are considered talented. The following options are available: sort by name, pct, roi, and wins. For purposes of the report an owner is considered talented if his or her record meets the following criteria: wins >= 5 AND roi >= 1.00.
- INDIVIDUAL OWNER - The drop down also contains all owner names found in the table. To run a report for an individual owner simply select the desired name from the drop down and click the Generate Reports Button.
--- end section for
CXN Exports ---
Export Build Times
I purchased a new Toshiba laptop in August, 2007. It has an AMD 64 X 2 Dual Core Processor, 2 GB of Ram, and a 250 GB hard drive. I typically download data for 7-10 tracks per day 7 days a week. I use a quarterly folder structure for my downloaded files. At the end of each calendar quarter I start a new folder. Each folder contains a PlayList File and several QuickIndex Files for that quarter’s data. Each PlayList File contains approximately 55,000 to 60,000 starters and 6,800 to 7,500 races. I’m pointing these things out because in the next paragraph I am going to report the Data Window Query and Export Build times I experience using my laptop. Your machine, data volume, and folder structure will determine your own Export Build Time experience – and it might very well be different from mine. I’m just giving you something to compare to.
A typical Data Window query where I run a UDM through the Data Window against one of my quarterly PlayList Files takes between one and two minutes. An ALL Button query on a quarterly PlayList File where a Jeff’s Track Profile Export is run with the query typically takes 2.5 to 3 minutes. A CXN Export is very much like running a Build Database on a PlayList File.
An ALL Button query on a quarterly PlayList File where a CXN Export is run at the same time for Riders and Trainers typically takes 15 to 17 minutes on my Toshiba Laptop. Considering the amount of information processed - a CXN Export on a quarterly PlayList File tabulates summary data for 5,400 to 5,800 separate Riders and Trainers – and considering what I do with that information during live play, 15 to 17 minutes a quarter seems rather reasonable.
--- end section for
Export Build Times ---
Cross Platform Text File Import
This feature allows you to import a list of plays
generated outside of JCapper into the JCapper Data Window for analysis.
These are the requirements:
1. You must have already built a JCapper database.
2. You must have a means of getting a list of plays generated outside of JCapper into a comma delimited text file.
3. The file name for the comma delimited text file must begin with the characters "Spot" (without the quotes.) The file extension must be ".txt" or ".TXT" (again without the quotes) and the data in the file itself must be in the proper format.
Here's a link to a properly formatted sample file:
Spots_IND10092015R6.txt
Notes:
1. Field mapping of the data in the file is four data fields, each data field enclosed inside of quote characters, as follows:
Field Name   Data Type	     Description
----------   -------------   --------------------------------------------------------------------------------
DATE         TEXT 10 Chars   "MO-DY-YEAR" (10 character date with MO DY and YEAR separated by dash character)
TRACK        TEXT  3 Chars   3 character Track Code same as first 3 characters from data file name)
RACE         TEXT  2 Chars   1 or 2 character race number (example: 10 indicates race 10)
HORSENAME    TEXT 25 Chars   Name of horse
2. Each field is string data type - meaning that the data in each field is simple text enclosed inside of quote characters.
3. The data points for the horses in your Spot*.txt file generated outside of JCapper must match the data points in the JCapper pl_profile.txt file you are querying. Otherwise, when you run a Cross Platform File Import in the JCapper Data Window you will not get any matches.
In order for a match between the two files to be found:
- The dates (including date format) in both files must be an exact match.
Hint: MO DY and YEAR in your Spot*.txt file should be separated by dash characters just like the date text in a JCapper pl_profile.txt file. - The 3 character track codes in both files must be an exact match.
Hint: 2 character track codes in your Spot*.txt file should be upper case and converted to 3 character track codes by adding an X character just like the track codes in a JCapper pl_profile.txt file. - The race number in both files must be an exact match.
- The horse names in both files must be an exact match.
Hint: If HORSENAME in your JCapper database has the punctuation characters stripped out (per your settings in the JCapper Enhanced Settings Module) then HORSENAME in your Spot*.txt file must also have the punctuation characters stripped out.
Also, if names of foreign bred horses in your JCapper pl_profile.txt file include the country where bred wrapped in parenthesis characters then foreign bred horses in your Spot*.txt file need to formatted the same way.
It doesn't matter how the plays in your Spot*.txt were generated. They could be coming out of an Excel spreadsheet, another handicapping program, manually generated using a pencil and the DRF, a list of plays based on your own physicality handicapping, tote handicapping, or even a crystal ball... < G > It really doesn't matter. So long as the above requirements are met you can import a list of plays into JCapper via the Cross Platform Text File Import MENU item.
- Launch the Data Window in Playlist File Mode (not sql mode.)
- Click MENU, select IMPORTS, and then select Cross Platform Text File Import.
IMPORTANT! Make sure you select IMPORTS in this step (not Exports!)
If you do accidentally select the Cross Platform Text File Export option, and from there select your Spot*.txt file in the next step, you will cause the Data Window to WRITE to your Spot*.txt file instead of read from it! (So be careful.) - A dialog box will appear. Use it to select and OPEN the Spot*.txt file that contains the list of plays you want to import.
Hint: When you do this you toggle on a Data Window Import. and you should see wording on the Data Window's title bar to the effect that a Data Window Import has been toggled on.
It is always a good idea to double check the wording on the Data Window's title bar. Make sure you have toggled on the import or export that you want to run before proceeding to the next step. - Select a breakout factor from the Factors Drop Down and use the ALL button or the UDM button to execute a playlist file mode Data Window query.
That's It!
The Data Window will import the list of plays cotained in the Spot*.txt file (from step 3 above) and search for and find exact matches (if there are any) in the pl_profile.txt file you are querying.
Upon completion of the query the Data Window will report exact matches found between the plays in the Spot*.txt file (from step 3 above) and the pl_profile.txt file you just queried with the results broken out by the breakout factor selected in the factors drop down.
--- end section for
Cross Platform Text File Import ---